Welcome!
Over the past few months, I’ve built myself a neat little prototype that lets me create video clips of map animations using LeafletJS. I’ve used this to create several Youtube videos over on my Exploring Winnipeg Parks Youtube Channel, when I’m explaining details about the location of parks or neighbourhoods.
The entire process uses several technologies:
- Python scripts using the Overpass API and OpenRouteService API to fetch geometries that I want to draw on the map. Both of these API’s make use of OpenStreetMap, the map database maintained by a global community of volunteers.
- The Shapely Python library to manipulate geometric shapes, and the PyProj Python library to handle geospatial co-ordinates.
- The LeafletJS JavaScript library to display interactive maps in a web browser window.
- A custom JavaScript prototype driven by a requestAnimationFrame loop, and a custom JSON file that describes the map animation steps to perform.
- OBS Studio to record the browser window into a video file.
- Any video editing software of your choice. I use an old version of Corel VideoStudio, but if you’re looking for a free open-source video editor, you can try out Kdenlive.
LeafletJS and the Web Browser
LeafletJS is typically used by websites that want to embed a map, displaying the location of their business or other points of interest. I used it extensively on the Exploring Winnipeg Parks website to display the location of parks, with map markers for points of interest and nearby bus stops.
LeafletJS provides a full-featured API for performing pan and zoom animations, displaying markers, and drawing paths or polygons over top of the map.
Modern web browsers provide plenty of native technologies that can be used to perform animations:
- The CSS animation property and @keyframes rule can provide precise control over animation sequences and transitions.
- SVG elements can be used to draw complex shapes, and CSS applies to them like any other HTML element.
- The Canvas API allows for more complex 2D graphics.
- The Web Animations API is something I was unaware of, right up until I was researching how others might be using web browsers to create video content. It apparently gained widespread browser support by about 2020, and is something I’ll have to look into!
Using the OpenRouteService API
OpenRouteService Maps is a fantastic online tool for visually generating routes on a map. It leverages all of the map data from OpenStreetMap, meaning it knows all about roadways, walking paths, and rivers. You can right-click on the map to declare each of your waypoints, and it calculates a route based on whether you want directions for walking, cycling, driving, or even wheelchair access. You can then download the file in one of several standardized formats, such as JSON.
To access the OpenRouteService API, you’ll need to set up an account and request an API key. For casual use, currently up to 7000 requests per day as of this writing, this is a free service.
The API can be accessed using an HTTP client. Here’s a short example in Python, where profile identifies whether you want instructions for driving (driving-car), walking (foot-walking), cycling (cycling-regular), etc. The waypoints is expected to be an array of [lon, lat] pairs. The ORS_API_KEY is expected to be defined elsewhere, and should be retrieved from a secure place.
import httpx
from shapely.geometry import LineString

def get_ors_route(profile, waypoints):
    url = f"https://api.openrouteservice.org/v2/directions/{profile}/geojson"
    headers = { "Authorization": ORS_API_KEY }
    body = { "coordinates": waypoints }
    with httpx.Client() as client:
        response = client.post(url, headers=headers, json=body)
        response.raise_for_status()
        response_data = response.json()
    output_coords = response_data["features"][0]["geometry"]["coordinates"]
    return LineString(output_coords)
The JSON response provides plenty of other information besides just the coordinates of the line segment, such as distance, approximate duration, and human-readable instructions. The above example is only extracting the line segment that you would display on a map. The OpenRouteService website provides an API Playground, where you can try out the API with full documentation.
JavaScript Animation Engine
My JavaScript animation engine makes use of the native requestAnimationFrame method. This is commonly used by web-based games to control their game loop. For my map animation engine, the basic pattern was as follows:
class LeafletAnimationManager {
    #leafletMap;
    constructor(containerElement) {
        this.#leafletMap = // initialize LeafletJS
    }
    runAnimation() {
        // Set start time with a 3-second buffer
        let startTime = performance.now() + 3000;
        requestAnimationFrame(this.#frameTick.bind(this));
    }
    #frameTick(now) {
        const elapsedTime = now - this.#startTime;
        const currFrame = Math.floor(elapsedTime / (1000 / 30)); // 30 FPS

        // Display a "countdown" for the first 3 seconds
        if ( currFrame < 0 ) {
            // Set textContent of a countdown <div> to currFrame
        } else {
            // Hide the countdown <div>
        }

        // Inspect map animation instructions, and trigger map animations as needed

        requestAnimationFrame(this.#frameTick.bind(this));
    }
}
I organized the map animation instructions into a simple array of custom objects. Each object tells the engine what animation action to perform, when to trigger it, and any additional information specific to the action. Thus far, I have a very small subset of actions that I support:
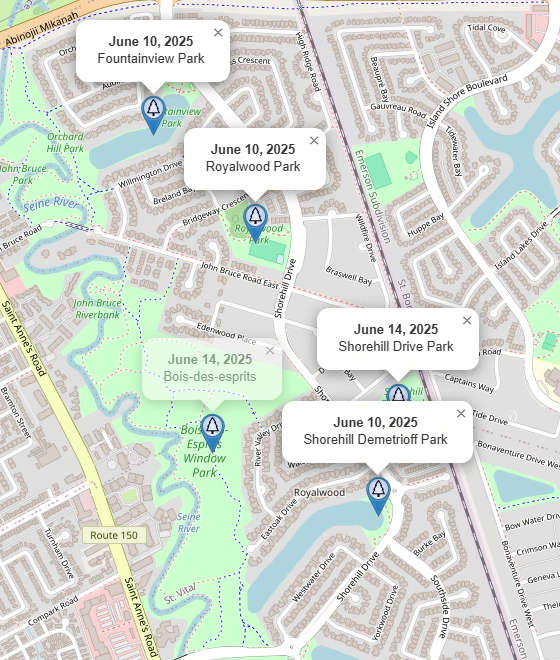
fly-towill call LeafletJSflyTo()with a given latitude, longitude, zoom, and animation duration.toggle-markerwill either show or hide a map marker, by adding or removing a CSS class name. It will also callbindPopup()/openPopup(), orclosePopup(), if popup text was provided.toggle-pathwill either show or hide a polygon or polyline, also by adding or removing a CSS class name.animate-pathextendstoggle-pathby also animating a polyline. It recalculates the polyline’s vertex list each frame using a standard technique called polyline interpolation (also known in GIS as linear referencing).
Once I’ve formalized my implementation, and added support for more features, I plan to build a web-based animation editor that can be run via a local web server.
Conclusion
I’m quite pleased with the results so far, and plan to continue to build on what I’ve done over this upcoming winter. I’m looking to expand the idea by going beyond just map-related animations, leveraging the web browser’s flexbox and CSS capabilities.
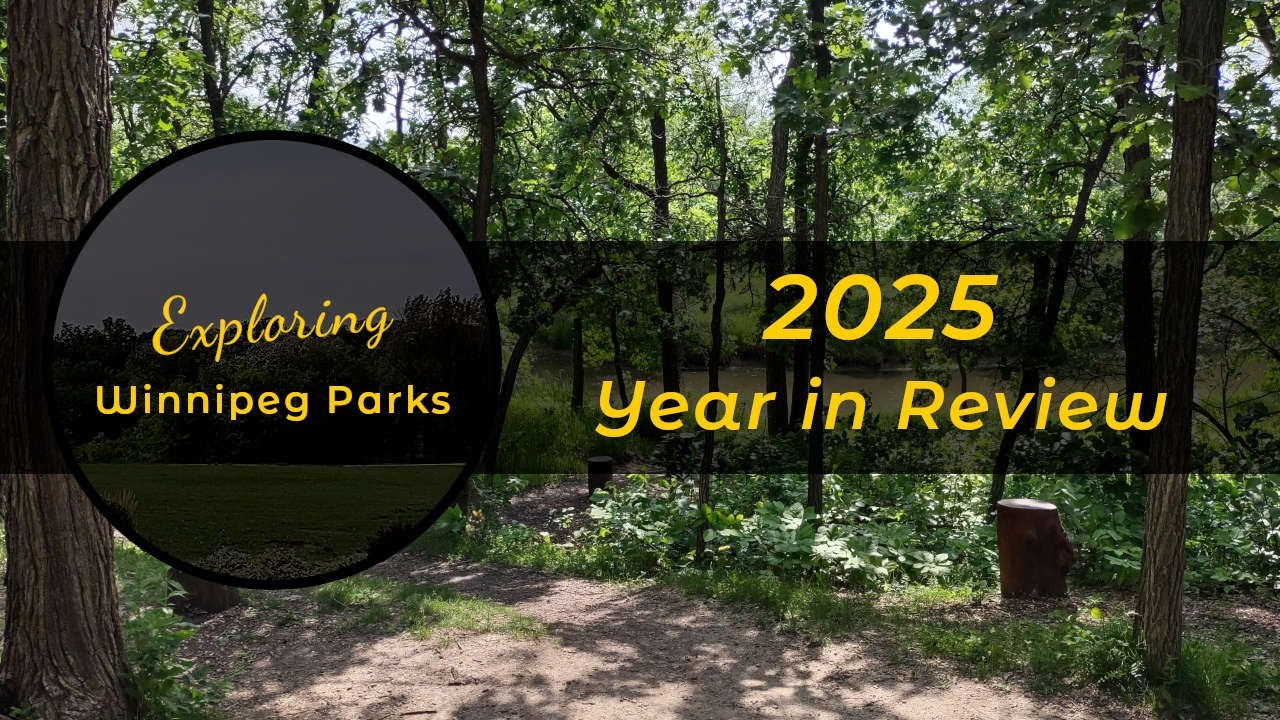
My “2025 Year in Review” video showcases the fly-to and toggle-marker animations:
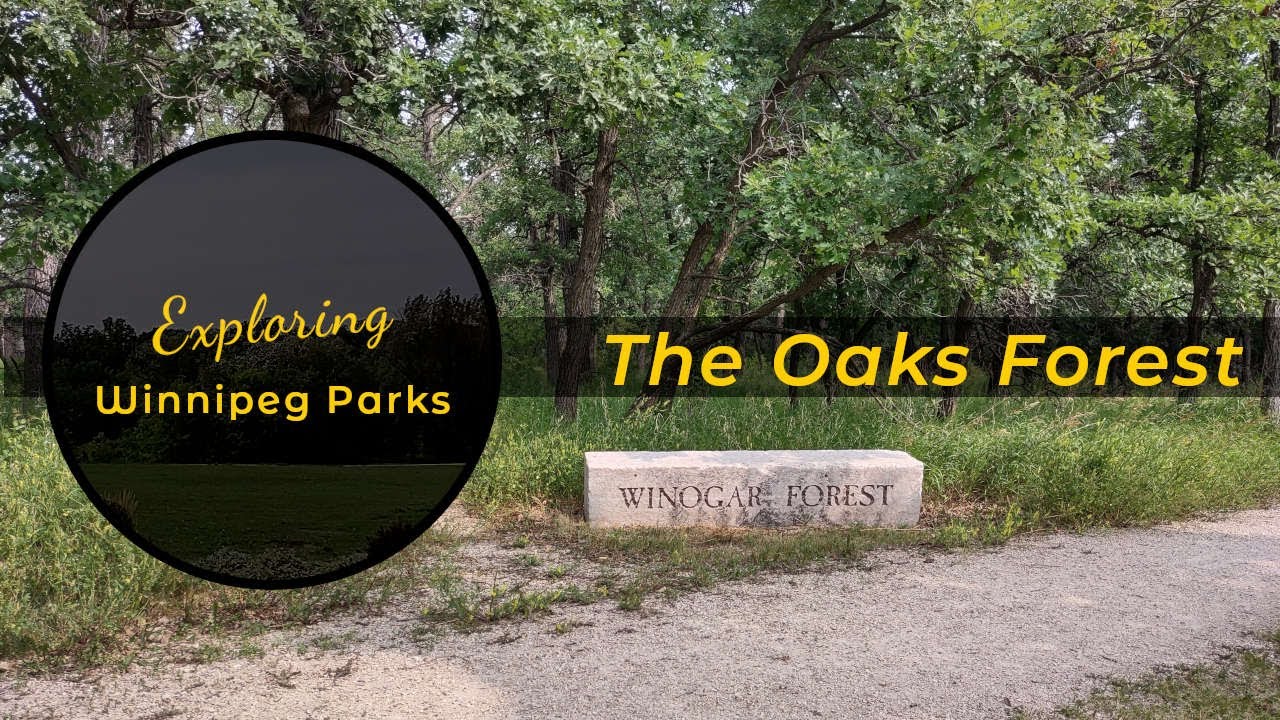
My “Oaks Forest Walkthrough” video showcases the toggle-path and animate-path animations:
While researching what others might be doing as it relates to creating map animation content, I found a rather intriquing academic article about an LLM-based tool called MapStory. You can find its home page on the University of Colorado Boulder’s ATLAS Institute at MapStory. I’ll be curious to see how this project progresses!